Sustainable analytics
Sustainable Analytics is a data analytics advisory organisation taking a healthier approach to analytics to develop sustainable and measurable solutions for the health and care organisations and healthcare technology providers they work with.
Sustainable analytics
Sustainable Analytics is a data analytics advisory organisation taking a healthier approach to analytics to develop sustainable and measurable solutions for the health and care organisations and healthcare technology providers they work with.
Sustainable analytics
Sustainable Analytics is a data analytics advisory organisation taking a healthier approach to analytics to develop sustainable and measurable solutions for the health and care organisations and healthcare technology providers they work with.
Sustainable analytics
Sustainable Analytics is a data analytics advisory organisation taking a healthier approach to analytics to develop sustainable and measurable solutions for the health and care organisations and healthcare technology providers they work with.
WHAT I DELIVERED
WHAT I DELIVERED
A bespoke hand rendered illustrated framework
Bold and captivating hand rendered web graphics
A bespoke hand rendered illustrated framework
Bold and captivating hand rendered web graphics
WHAT I DELIVERED
A bespoke hand rendered illustrated framework
Bold and captivating hand rendered web graphics
PROJECT OVERVIEW
PROJECT OVERVIEW
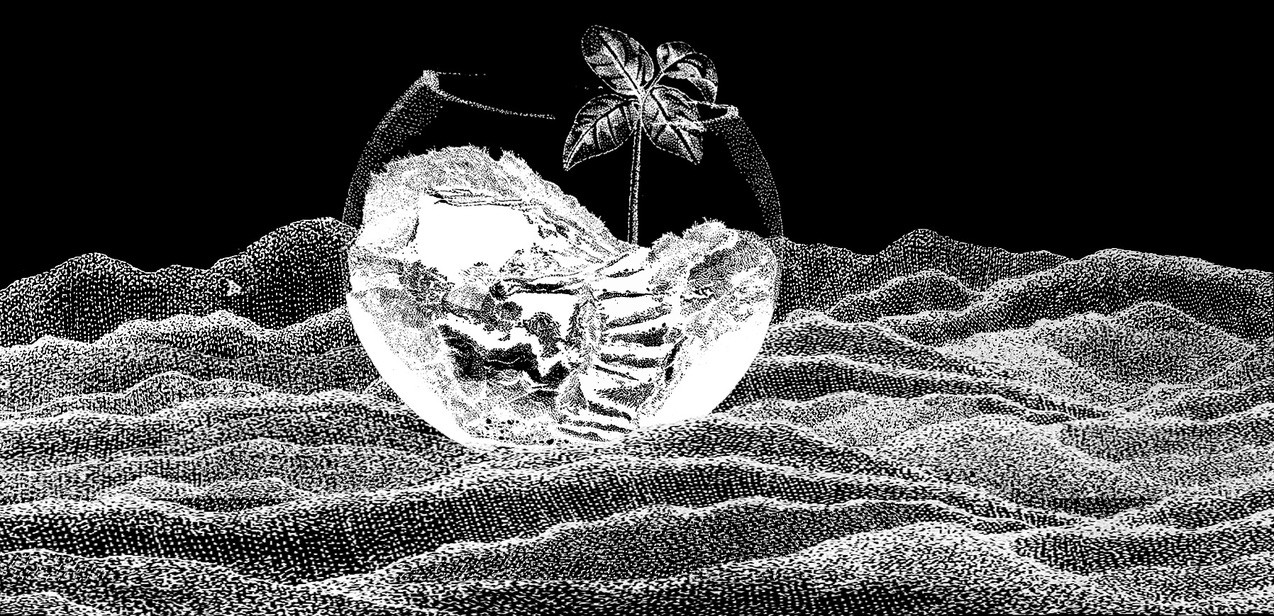
As part of Sustainable Analytics’ rebrand I created a set of stippling illustrations to support their value statement. Illustration is a fantastic way to explain complex content that you are struggling to bring to life.
As part of Sustainable Analytics’ rebrand I created a set of stippling illustrations to support their value statement. Illustration is a fantastic way to explain complex content that you are struggling to bring to life.
As part of Sustainable Analytics’ rebrand I created a set of stippling illustrations to support their value statement. Illustration is a fantastic way to explain complex content that you are struggling to bring to life.
PROJECT OVERVIEW
As part of Sustainable Analytics’ rebrand I created a set of stippling illustrations to support their value statement. Illustration is a fantastic way to explain complex content that you are struggling to bring to life.
THE CONCEPT
THE CONCEPT
With the client’s very complex offering and framework, the illustrations served to simplify each step. The stippling technique I used involves hundreds of small marks on a page that give the impression of particles or packets of data.
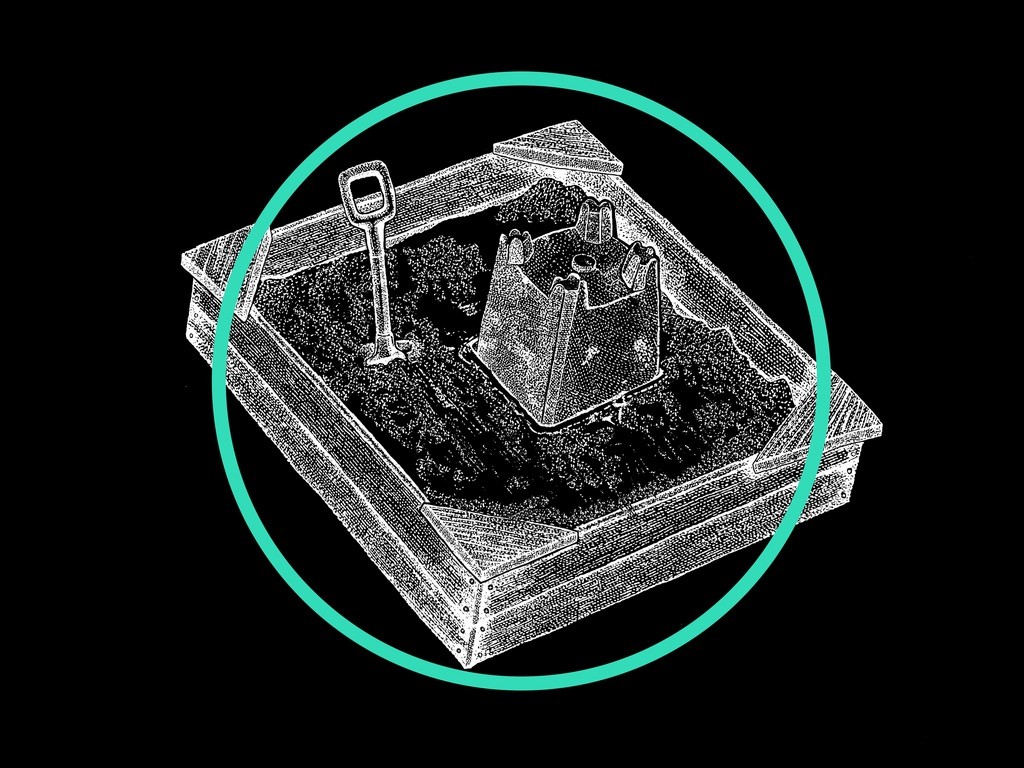
I incorporated the teal circle from the marque into each image, using it to highlight important areas or to complete the illustration. This puts the Sustainable Analytics brand at the heart of change for their customers and builds consistency across their visual portfolio.
Hand rendered work instantly brings humanity into a design, an important aspect in making Sustainable Analytics feel more approachable and less mechanical.
With the client’s very complex offering and framework, the illustrations served to simplify each step. The stippling technique I used involves hundreds of small marks on a page that give the impression of particles or packets of data.
I incorporated the teal circle from the marque into each image, using it to highlight important areas or to complete the illustration. This puts the Sustainable Analytics brand at the heart of change for their customers and builds consistency across their visual portfolio.
Hand rendered work instantly brings humanity into a design, an important aspect in making Sustainable Analytics feel more approachable and less mechanical.
THE CONCEPT
With the client’s very complex offering and framework, the illustrations served to simplify each step. The stippling technique I used involves hundreds of small marks on a page that give the impression of particles or packets of data.
I incorporated the teal circle from the marque into each image, using it to highlight important areas or to complete the illustration. This puts the Sustainable Analytics brand at the heart of change for their customers and builds consistency across their visual portfolio.
Hand rendered work instantly brings humanity into a design, an important aspect in making Sustainable Analytics feel more approachable and less mechanical.
THE DESIGN
THE DESIGN
I opted to create the illustrations in a realism style to help the audience form immediate connections between text and image. This helped to further simplify the brand’s elaborate framework.
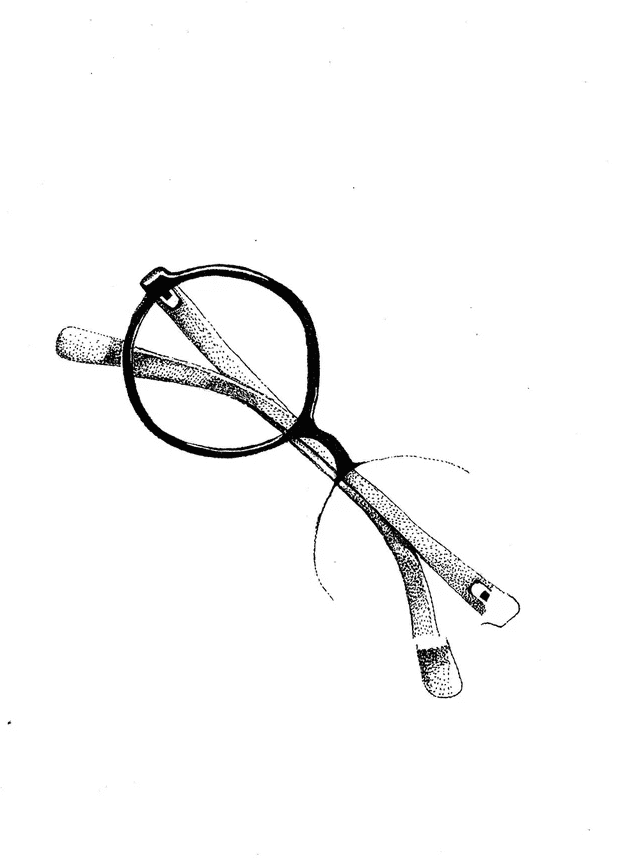
Every illustration is a metaphorical representation of the framework stage it correlates to, for example, the company’s ‘fit for purpose’ approach is characterised by a pair of spectacles, as each company’s data is different, much like prescription lenses are tailored to the individual wearer.
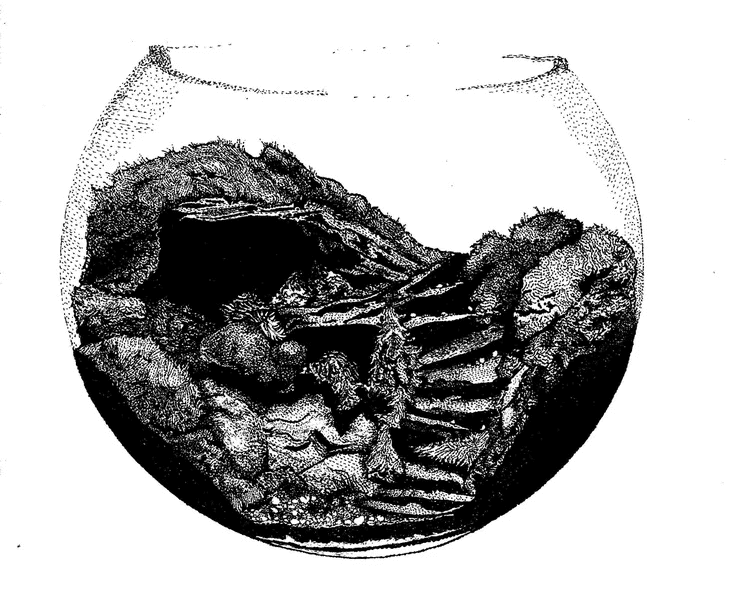
Each object chosen for illustration is also a tool in some capacity, demonstrating the tangible ways Sustainable Analytics helps their customers. That is, except for the main illustration — the terrarium. A self-sufficient, long-lasting micro ecosystem to represent how investing in data analytics for your business now can help you grow your internal capability for the future.
I opted to create the illustrations in a realism style to help the audience form immediate connections between text and image. This helped to further simplify the brand’s elaborate framework.
Every illustration is a metaphorical representation of the framework stage it correlates to, for example, the company’s ‘fit for purpose’ approach is characterised by a pair of spectacles, as each company’s data is different, much like prescription lenses are tailored to the individual wearer.
Each object chosen for illustration is also a tool in some capacity, demonstrating the tangible ways Sustainable Analytics helps their customers. That is, except for the main illustration — the terrarium. A self-sufficient, long-lasting micro ecosystem to represent how investing in data analytics for your business now can help you grow your internal capability for the future.
THE DESIGN
I opted to create the illustrations in a realism style to help the audience form immediate connections between text and image. This helped to further simplify the brand’s elaborate framework.
Every illustration is a metaphorical representation of the framework stage it correlates to, for example, the company’s ‘fit for purpose’ approach is characterised by a pair of spectacles, as each company’s data is different, much like prescription lenses are tailored to the individual wearer.
Each object chosen for illustration is also a tool in some capacity, demonstrating the tangible ways Sustainable Analytics helps their customers. That is, except for the main illustration — the terrarium. A self-sufficient, long-lasting micro ecosystem to represent how investing in data analytics for your business now can help you grow your internal capability for the future.


THE EXECUTION
THE EXECUTION
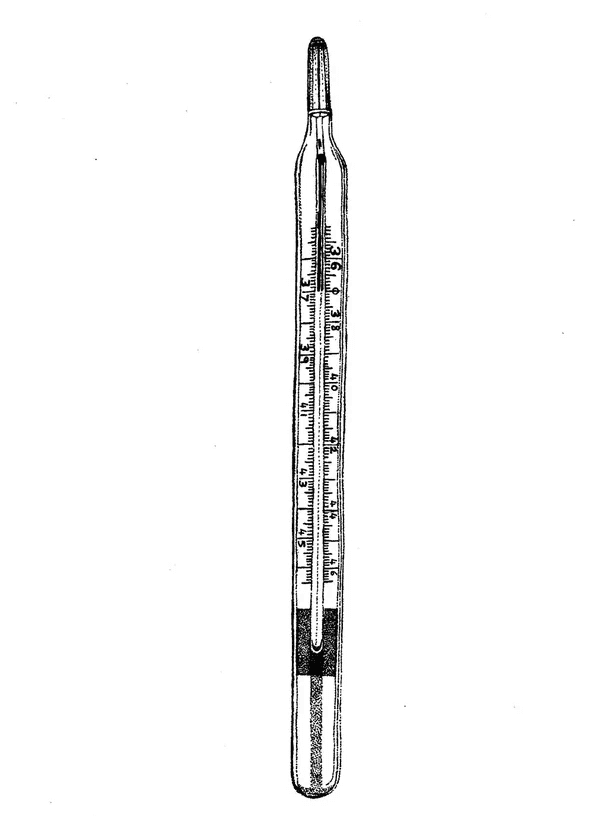
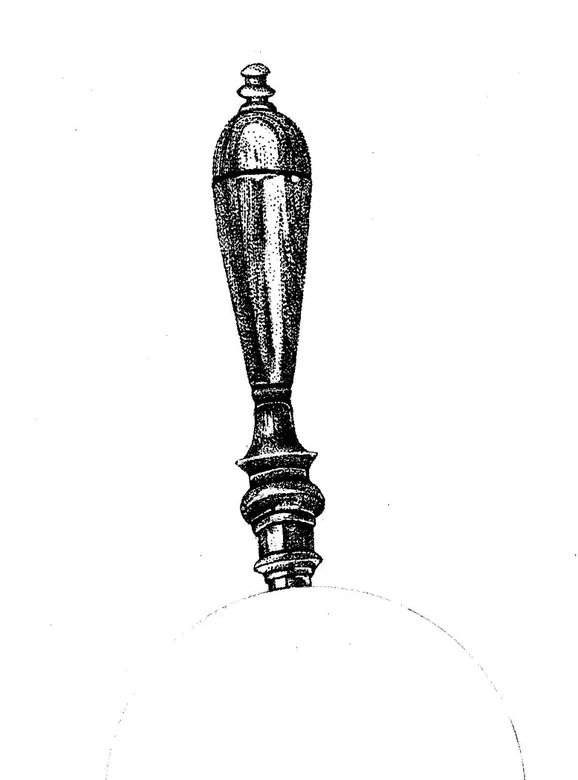
The technique I used to create the illustrations — stippling — is done by hand. Small dots drawn at varying proximities to one another form tones of dark and light. It’s a style that affords me flexibility in creating accurate textures, and lends itself well to the exploration of true-to-life, realistic forms.
This project required a high level of collaboration with the client. Stippling is a time-consuming process, so it was vital to ensure they were satisfied with each image before I began putting pen to paper. Every pair of glasses and every thermometer was run past them so the end result was exactly as envisaged.
THE EXECUTION
The technique I used to create the illustrations — stippling — is done by hand. Small dots drawn at varying proximities to one another form tones of dark and light. It’s a style that affords me flexibility in creating accurate textures, and lends itself well to the exploration of true-to-life, realistic forms.
This project required a high level of collaboration with the client. Stippling is a time-consuming process, so it was vital to ensure they were satisfied with each image before I began putting pen to paper. Every pair of glasses and every thermometer was run past them so the end result was exactly as envisaged.

©2024 TOBY WOOD
GO BACK TO TOP
©2024 TOBY WOOD
GO BACK TO TOP